Post 4

Insights
One of our questions we want to answer when looking at audio features of a song is which one of these many features really pushes a song to be popular? So far we have a working classifier that accurately classifies a song from our dataset as popular or unpopular with about 87% success. Now we are going to dive into each feature in our feature set and examine how our classifier weighs each of their relevance. Hopefully we find something interesting to learn from this. As of now, we predict that genre, loudness, and tempo will probably have larger influence than some of the more subtle features like acousticness and mean segment timbre (the average timbre of a song which in and of itself is hard to quantify.) Once we have more analysis, we will package our insights into a nice format to present as users try out our classification for their own songs.
Visualizations
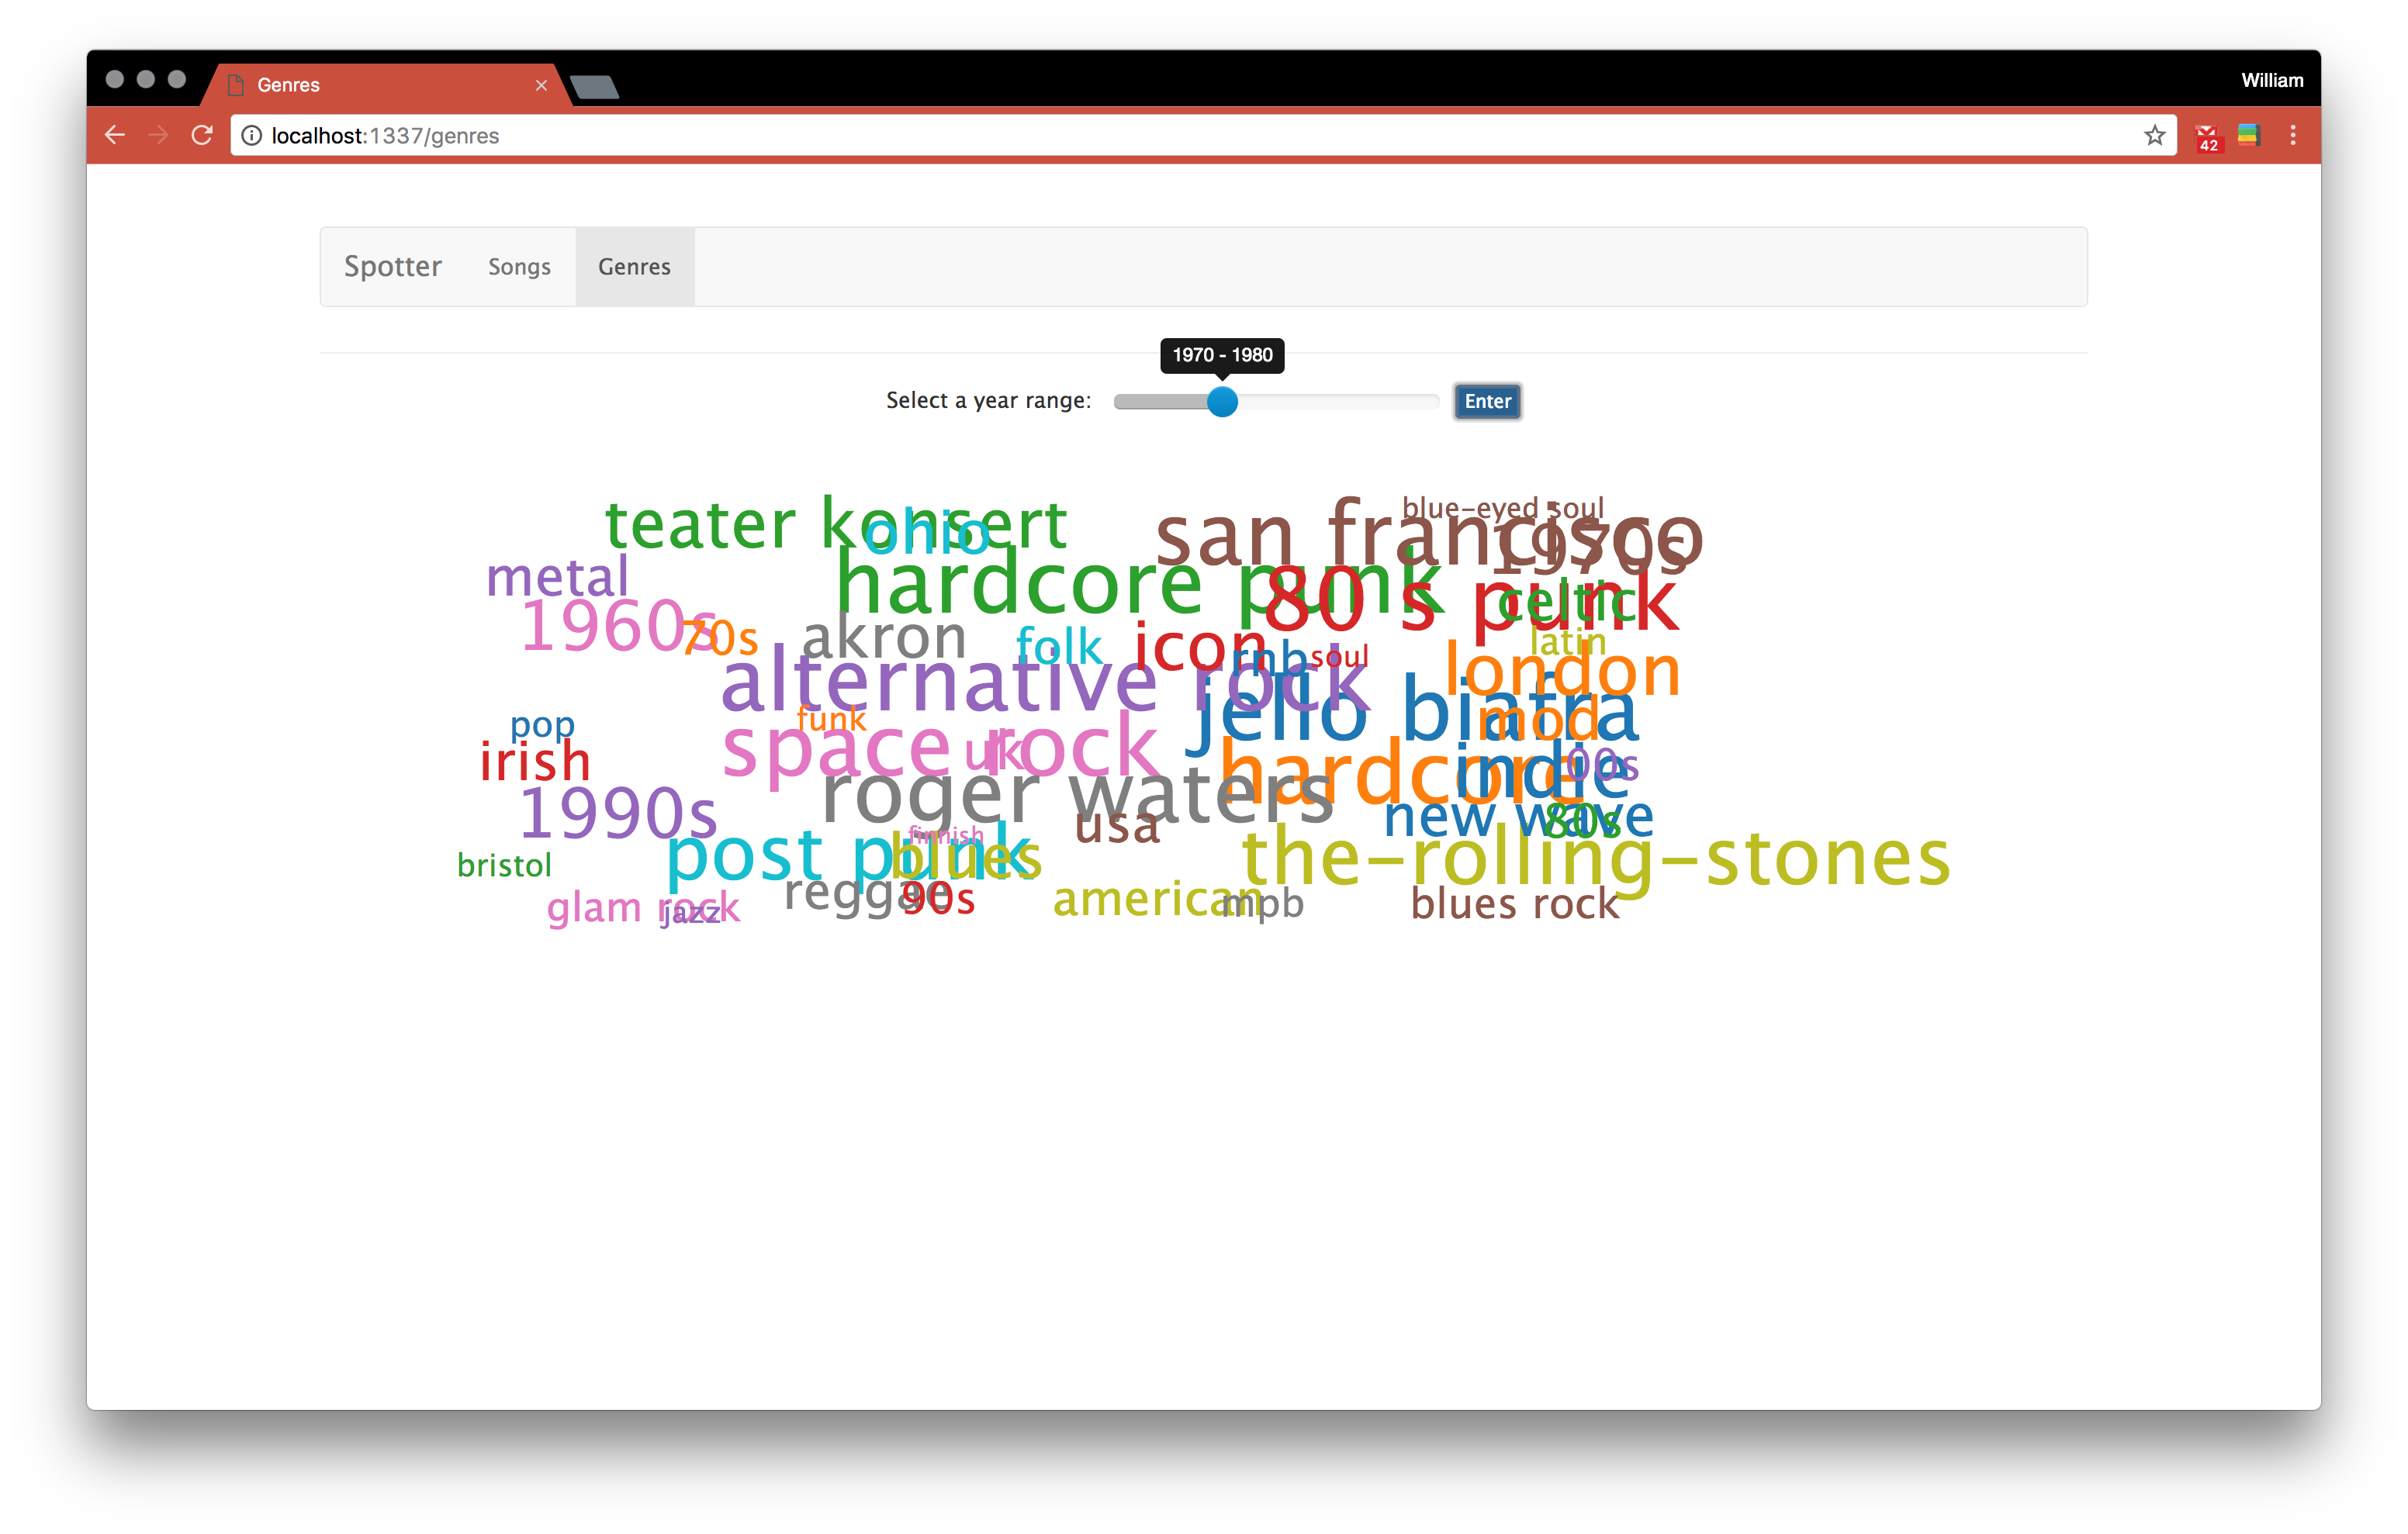
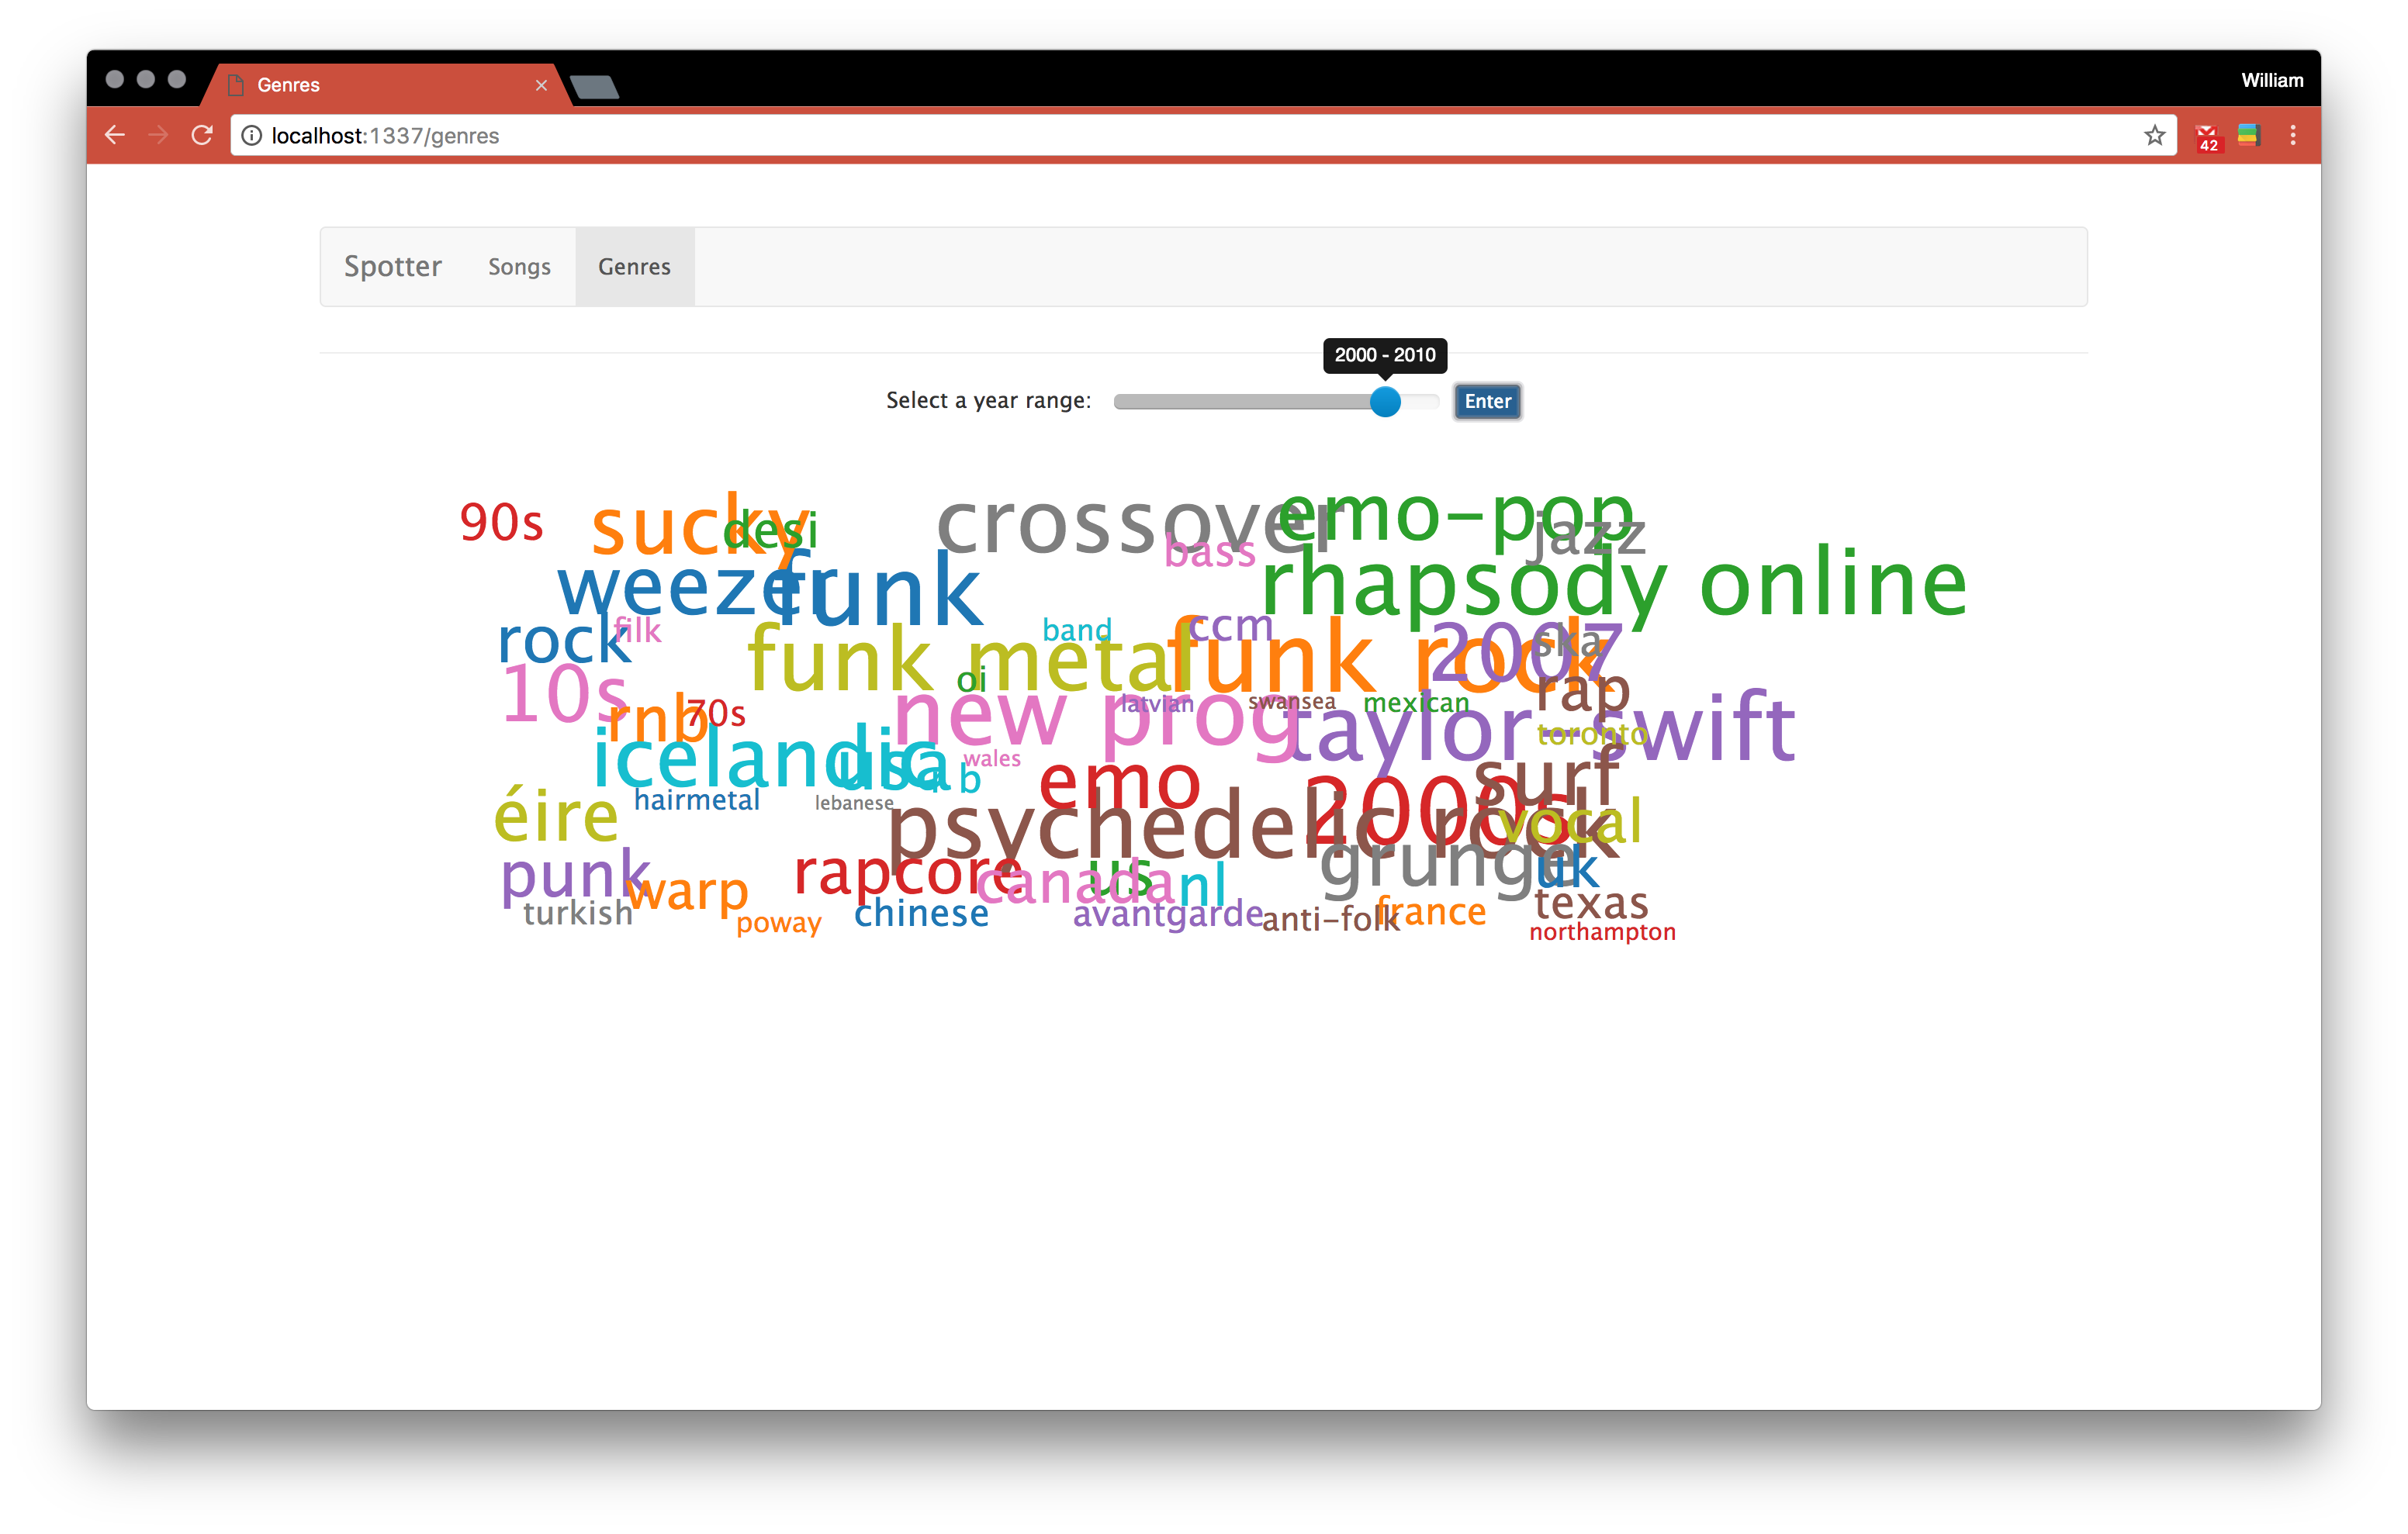
One new visualization that we wanted to create was some way to view genre development over time. Genres’ relevance can change drastically in even short periods of time (does dub step still have the same appeal as it did in 2010?). Having a cool visualization to showcase changing views on genre would add to our web application as a nice side piece. So we decided to create a visualization that creates wordles for relevant genres for specific year ranges. A user will be able to slide the year range that defines the wordle to see different results. Here’s an example of it in use:
Finishing Up
Now that we have some components of our project coming together, it’s time to wrap up what we’ve learned and package our project together in a nice web app. We have working classifiers in our python scripts that our node.js application will need to call. Additionally, we will have to incorporate our Spotify API searches in order for users to test our classifier themselves and then present the audio features of song lookups in order for people to see why their song may or may not have been considered “popular.”