Post 2

Visualizations
We used D3 for our data visualizations with the database of songs and jams that we created. To start off, we wrote a query that grabs all jams and the number of likes for each jam associated with a particular song. Currently, our web app provides a simple UI for users to search for a song by name. Our backend that queries our database for the given song and sends data to our front end to populate a line graph that graphs the number of jams and their likes by the jam's creation date.
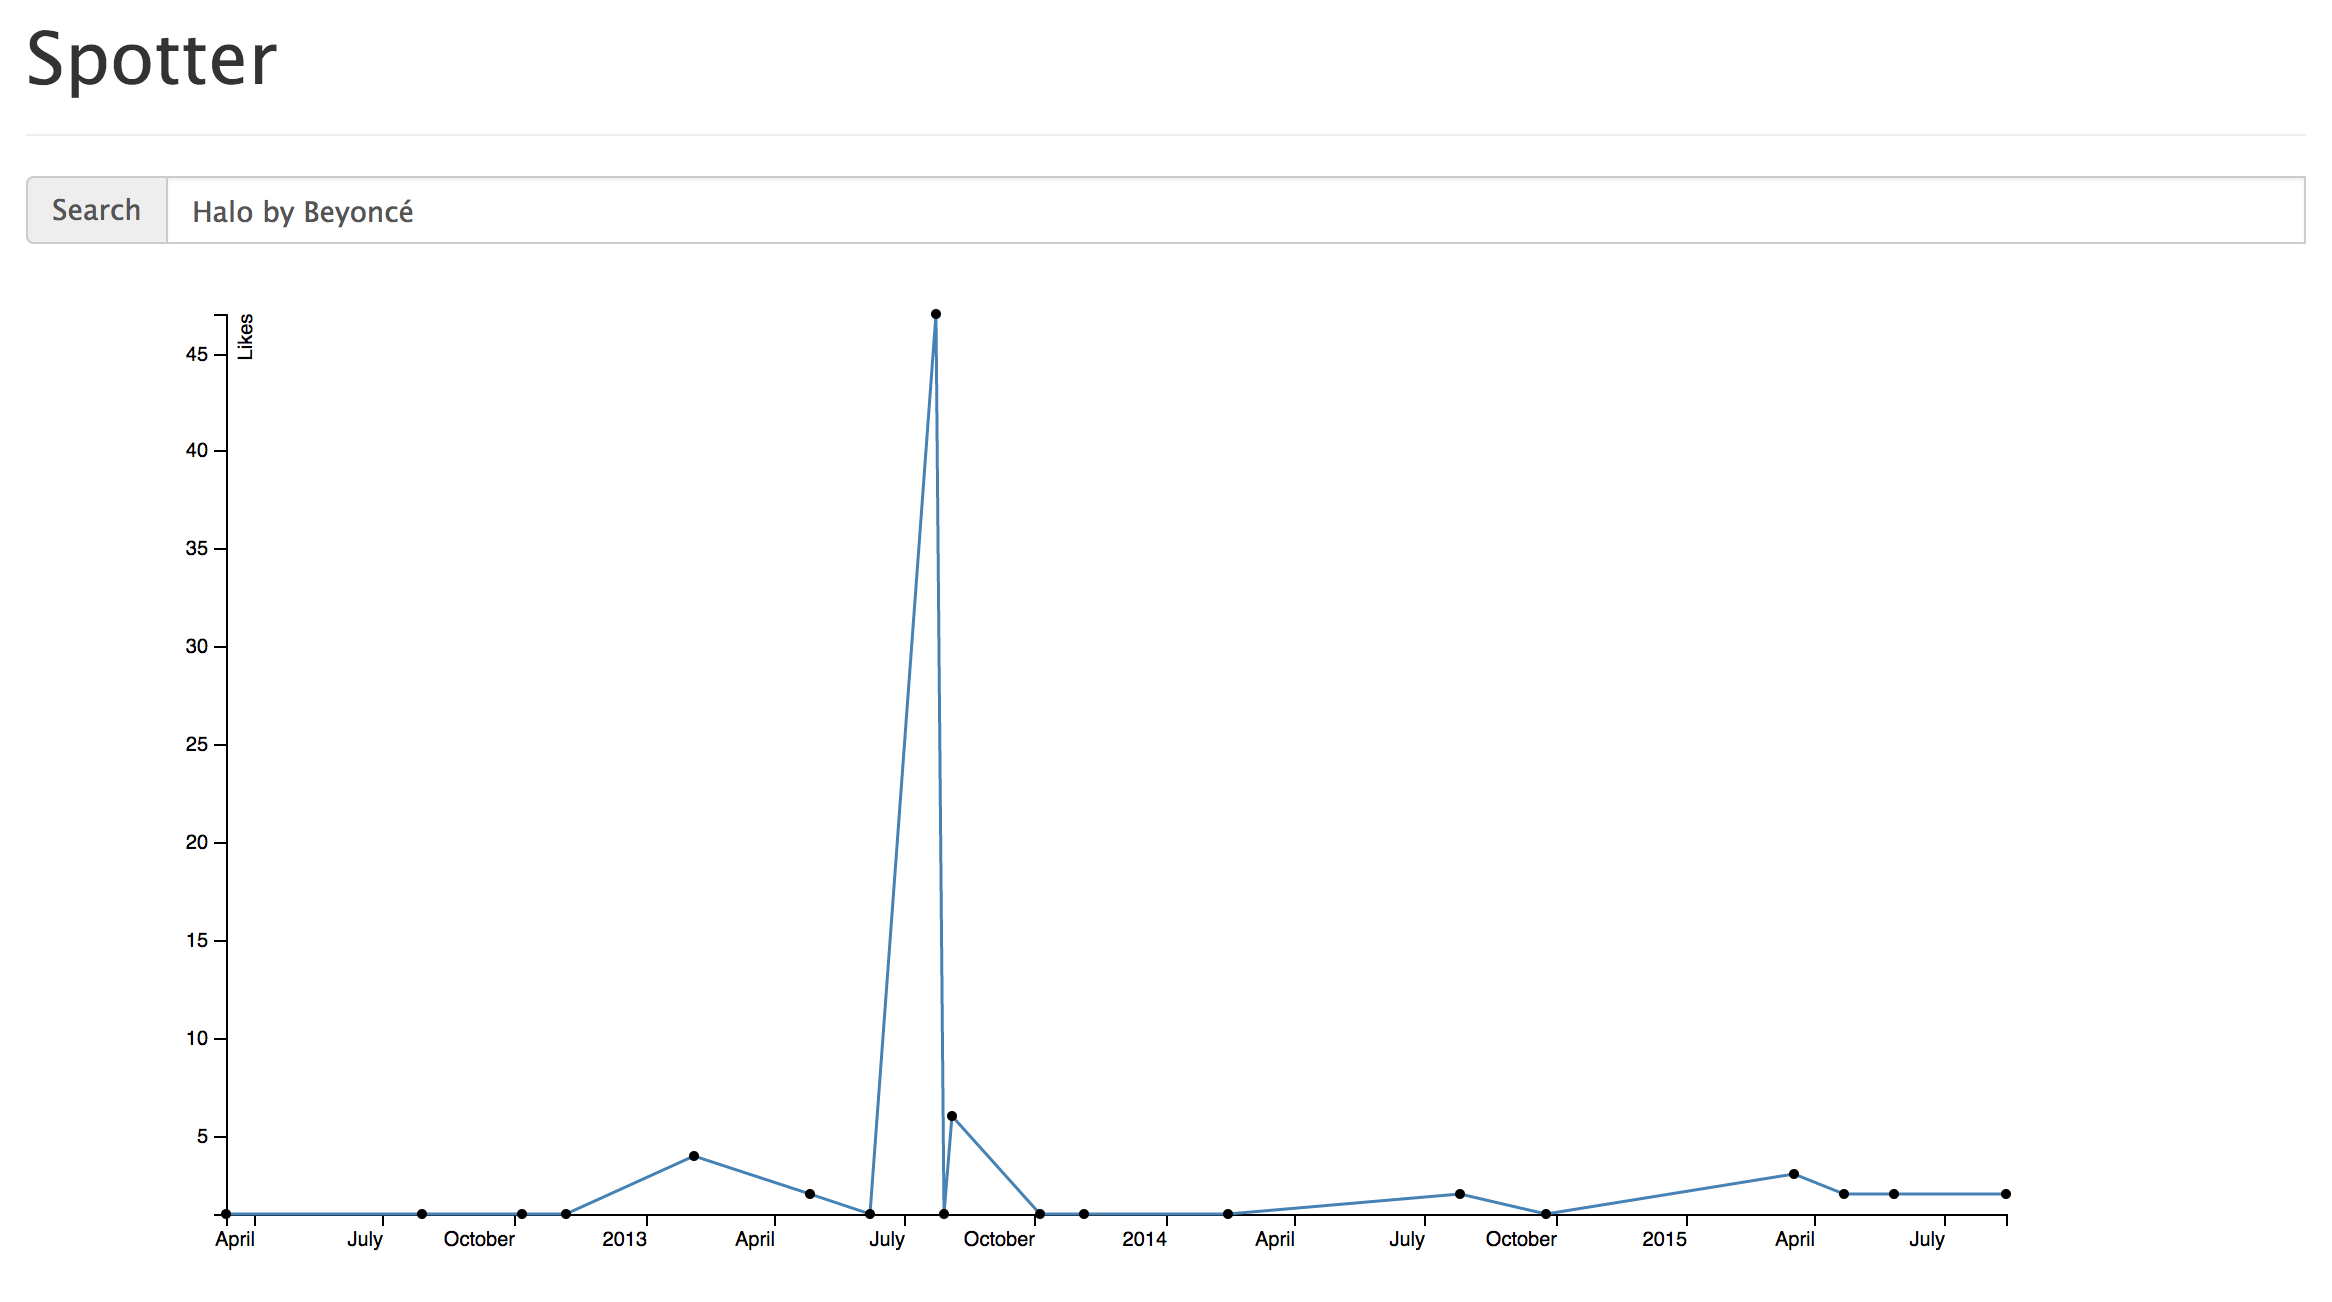
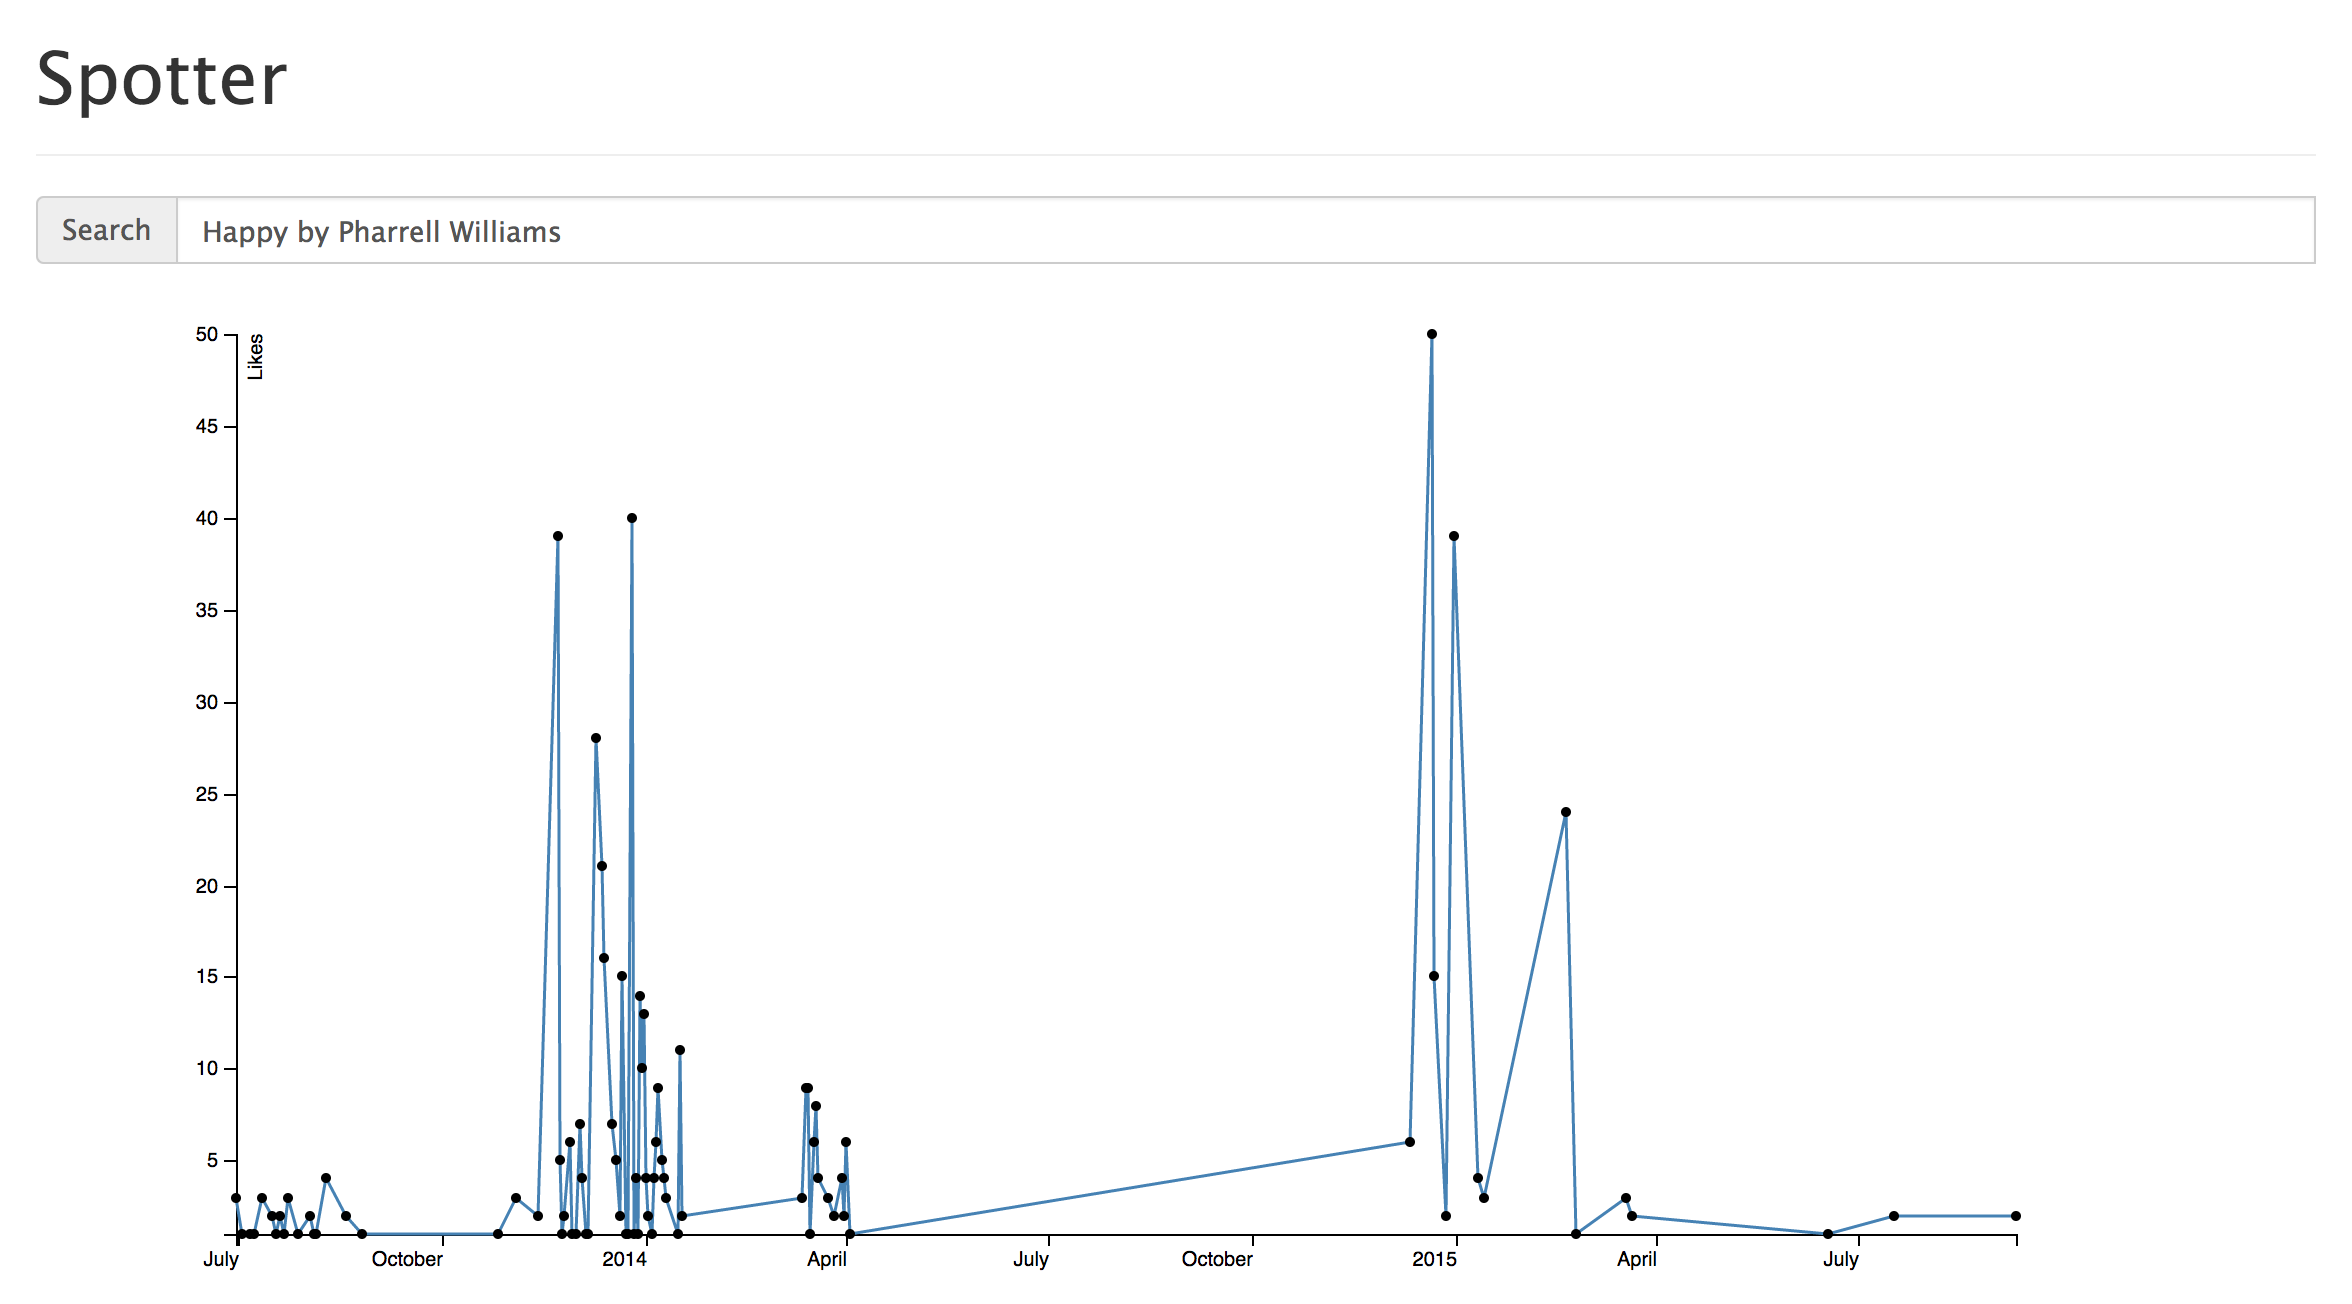
Above are two visualizations of our data for two popular songs: Halo by Beyonce and Happy by Pharrell Williams. We can see that Happy had a spike in popularity initially when it was first release (November 21st, 2013), and then once more near the beginning of 2015. A reasonable assumption
Machine Learning
We used a LogisticRegression classifier. For the features we used acousticness, danceability, energy, instrumentalness, loudness, mode, speechiness, tempo, valence, liveness from our database. We believe these values would be in correlation with our label-spotify_song_popularity. We also do a 10-fold cross validation so that we don't overfit our training data. However, our numbers were not very promising. We got 42.5% accuracy for the training data and 40% for the test data. We believe this is because of two things. Firstly, most of the values for song popularity we have are 0's. This, and the fact that we don't know how spotify comes up with these values suggest that we should look at creating our own metric for popularity. We will be using the number of likes instead. Secondly, we are using a subset of our data for training and we intend to train our classifier on a larger subset.
Challenges
Ultimately, our classifier failed to correctly classify our data, due to the skewed nature of our Spotify popularity metric.
The number itself is not well defined by the Spotify and is influenced by the number of listens by Spotify users. Our goals for
this project were to use Spotify popularity as a comparison to our This Is My Jam data, not as our main indicator of popularity.
The main reason we had used Spotify popularity is due to issues with how our initial data pruning of our This Is My Jam dataset. Due
to the nature of the data (having songs rely on user input to match with a Spotify URI), a lot of our jam posts did not have a URI.
Thus posts on certain songs would not be counted in our likes metric and would lead to uninteresting results for various artists and songs
where users would give incorrect and slightly modified spellings.